Independent Music Market – Analytics Platform for Ticket Sales
Automated Reporting, Data Aggregation, and Market Intelligence
Overview
A custom analytics platform that eliminates manual reporting and centralizes sales data from multiple ticketing systems.
Technologies Used
Overview
The client operates in the event ticketing industry and relies on multiple independent ticket sales platforms.
Each platform provided its own reports, data formats, and analytics, making it difficult to gain a unified view of the business.
As a result, sales analysis required significant manual effort every day.
Employees had to download reports from multiple sources, merge them in spreadsheets, and manually prepare summaries to evaluate event performance, pricing strategies, and market trends.
The goal of this project was to eliminate that process and create a single source of truth for the entire organization.
The Business Challenge
The company used five independent ticketing platforms.
Every day, employees had to:
- download reports from multiple systems,
- clean and organize the data,
- merge datasets in spreadsheets,
- analyze event performance,
- monitor sales trends and market activity.
The process was time-consuming, repetitive, and prone to human error.
Most importantly, valuable business insights were only available after employees completed a large amount of manual work.
The Solution
I designed and built a centralized analytics platform that automates the entire data collection and reporting workflow.
The system automatically gathers data from multiple sources, normalizes it, and presents it through a unified dashboard.
Instead of preparing reports manually, the team now receives ready-to-use business insights every day.
Key capabilities
- Automated data collection from multiple sources
- Scheduled synchronization jobs
- AI-powered data normalization
- Centralized business intelligence dashboard
- CSV exports
- Audit logging and operational transparency
- Automated reporting workflows
System Architecture
The platform was designed as a scalable data processing system consisting of several layers:
- Data acquisition layer (web scraping and integrations)
- Data processing and normalization layer
- Analytics layer
- Administrative dashboard
- Job scheduling and automation layer
This architecture makes it easy to add new data sources without redesigning the entire platform.
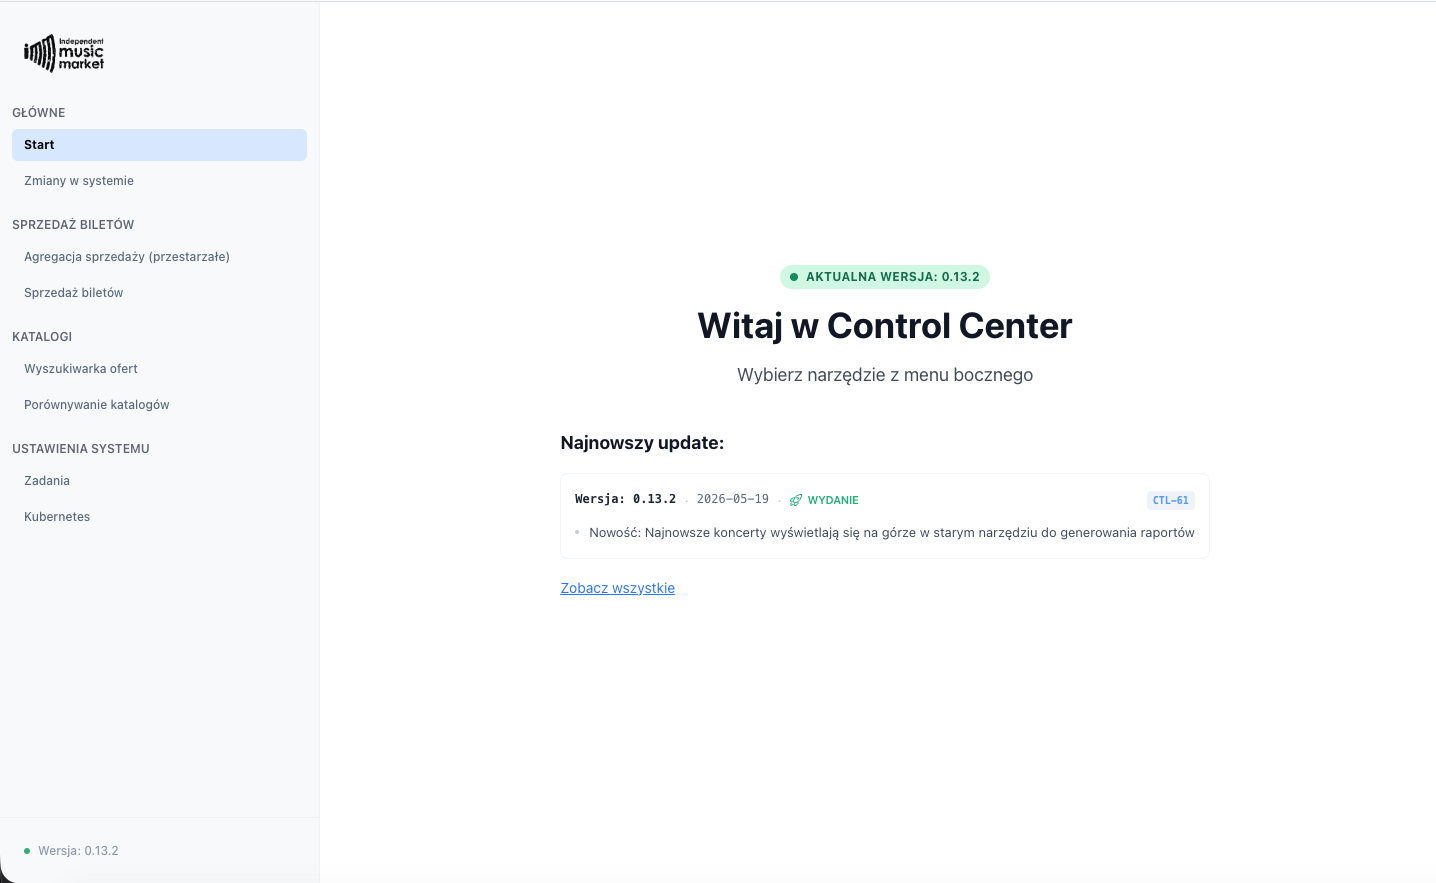
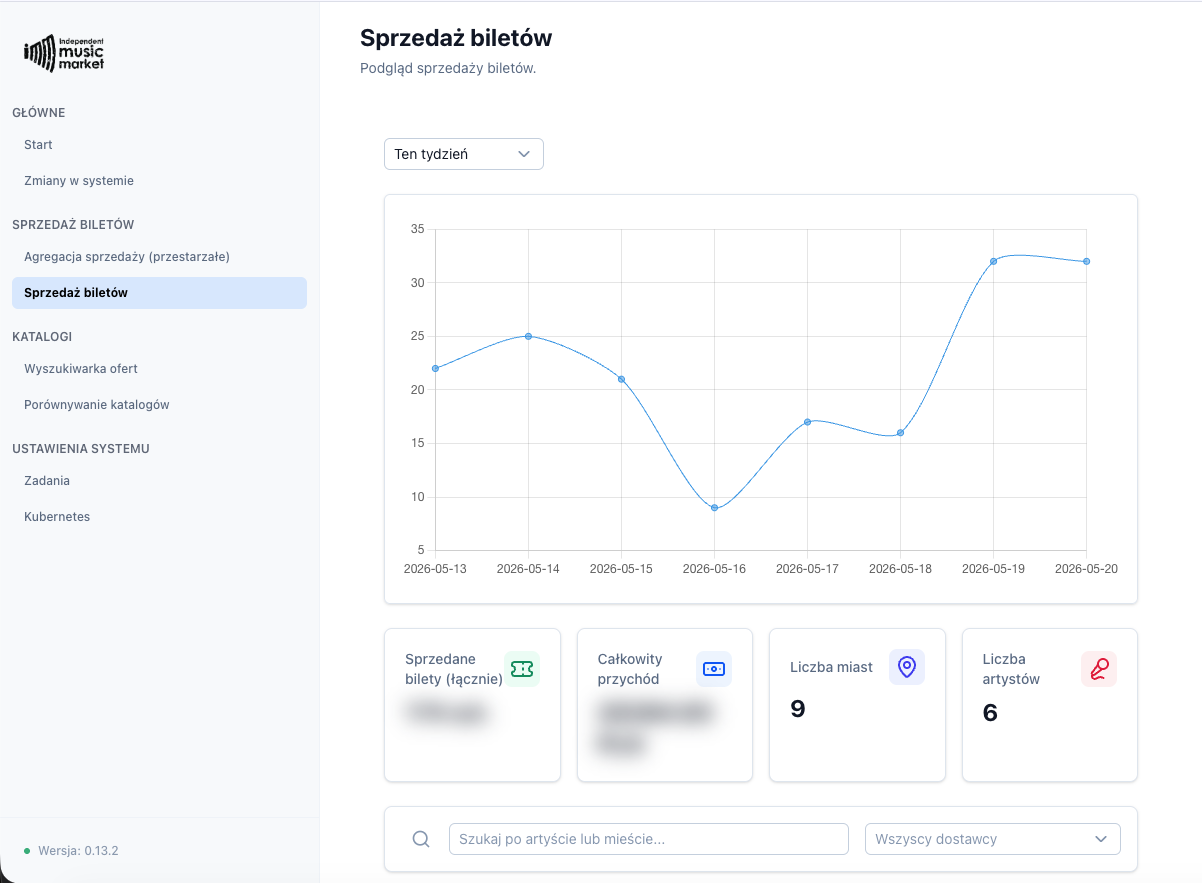
Operations Dashboard
The platform provides a centralized dashboard where users can monitor all key business metrics in one place.
The dashboard includes:
- sales performance tracking,
- market trends,
- synchronization status,
- operational activity logs,
- automated reporting insights.
AI-Powered Data Processing
One of the biggest technical challenges was unifying data coming from multiple independent sources.
To solve this problem, AI models are used to:
- normalize event names,
- identify products,
- group related records,
- eliminate duplicates,
- standardize inconsistent data structures.
This allows information from multiple ticketing systems to be analyzed through a single business model.
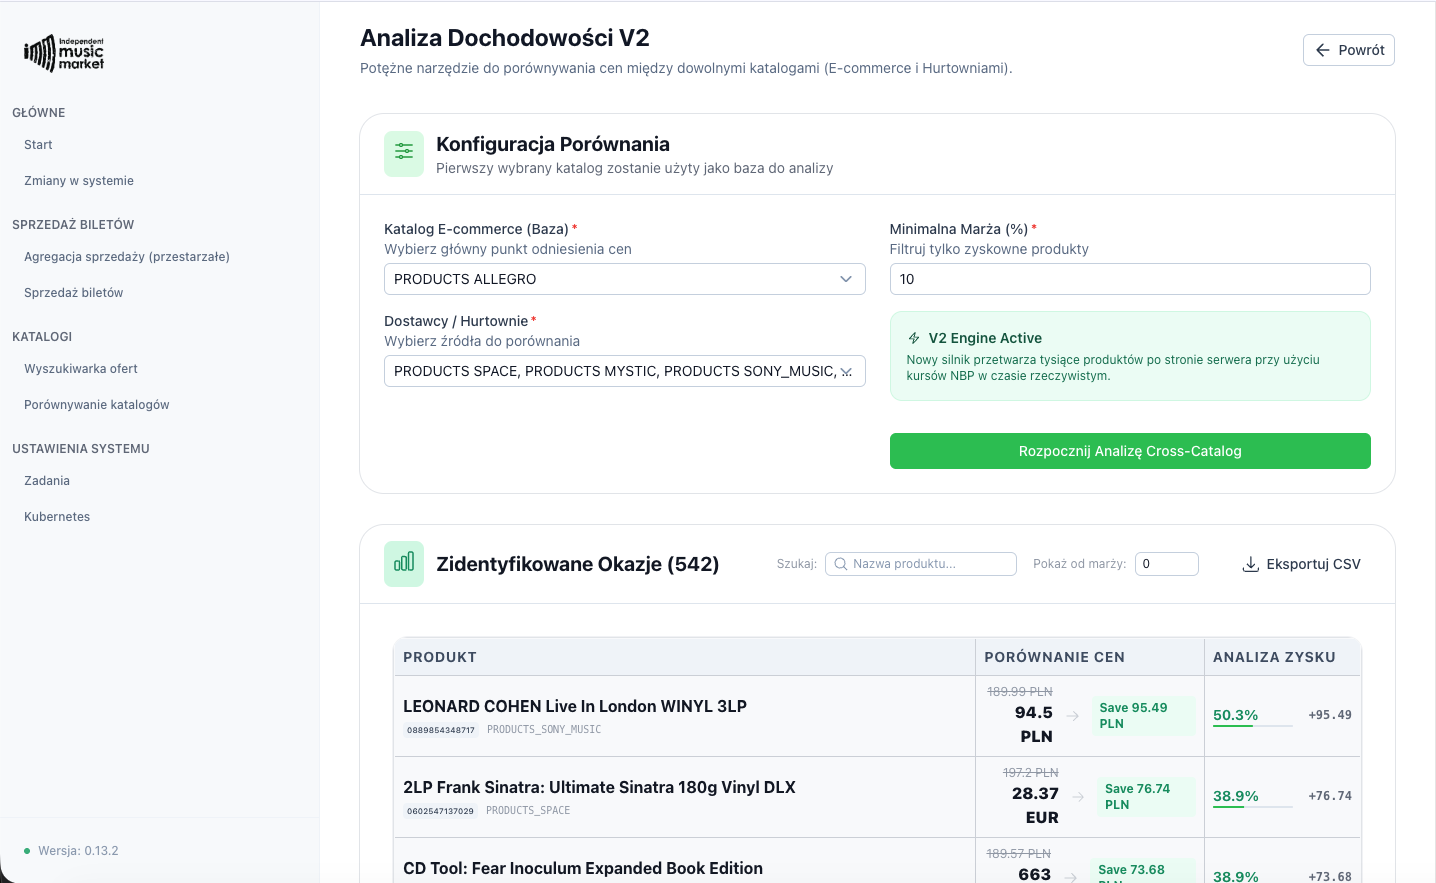
Market Analysis & Decision Support Tools
Beyond reporting, the platform also provides tools that support business decision-making.
One example is an offer comparison engine that allows users to compare products across different marketplaces and supplier catalogs.
The system helps identify profitable opportunities and enables faster, data-driven decisions.
Business Impact
After implementation:
- Manual reporting workflows were virtually eliminated
- Data from multiple platforms became centralized
- Time required for sales analysis was significantly reduced
- Data consistency and quality improved
- Business decisions became faster and more data-driven
The most valuable outcome was not the dashboard itself, but the elimination of a repetitive operational process that previously required daily employee involvement.
Technologies Used
Vue.js, Node.js, TypeScript, MongoDB, Docker, OpenAI
Conclusion
This project demonstrates that digital transformation does not always require replacing existing systems.
In many cases, the greatest business value comes from building an automation layer around existing workflows, eliminating manual work while leveraging the tools a company already uses.
The result is faster access to information, fewer operational errors, and a more efficient organization.